02 / Case study
CPU Scheduling Simulator
C-based CPU scheduling simulator that runs FCFS, SJF/SRTF, Round Robin, and preemptive or non-preemptive Priority scheduling, then outputs Gantt charts and process timing metrics.
Overview
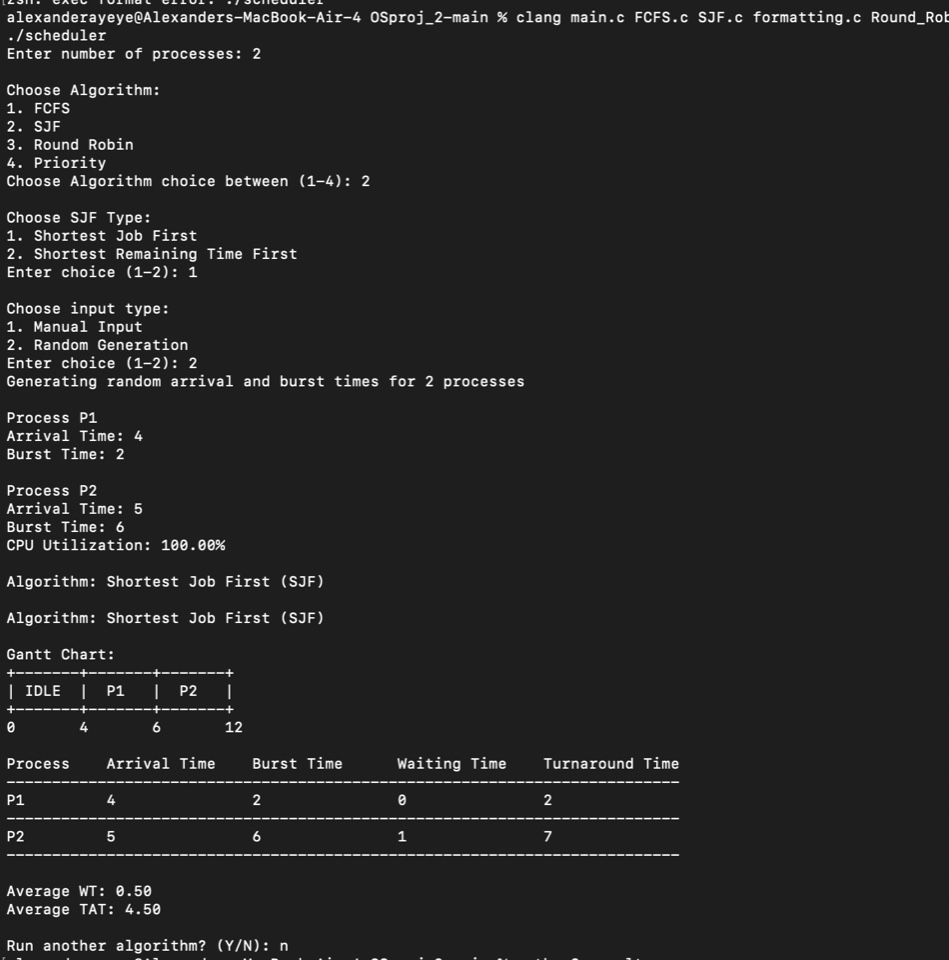
I contributed to a CPU scheduling simulator that makes process-order decisions visible instead of treating scheduling as a black box. It accepts manual or generated process data and reports execution order, waiting time, turnaround time, and CPU utilization for comparison.
Contribution
I implemented the FCFS Gantt-chart output and SJF/SRTF logic, then added CPU-utilization calculations for FCFS, SJF, Round Robin, and Priority. I also worked within the team’s shared C structure for algorithm execution, formatted output, and repeated simulation runs.
Implementation
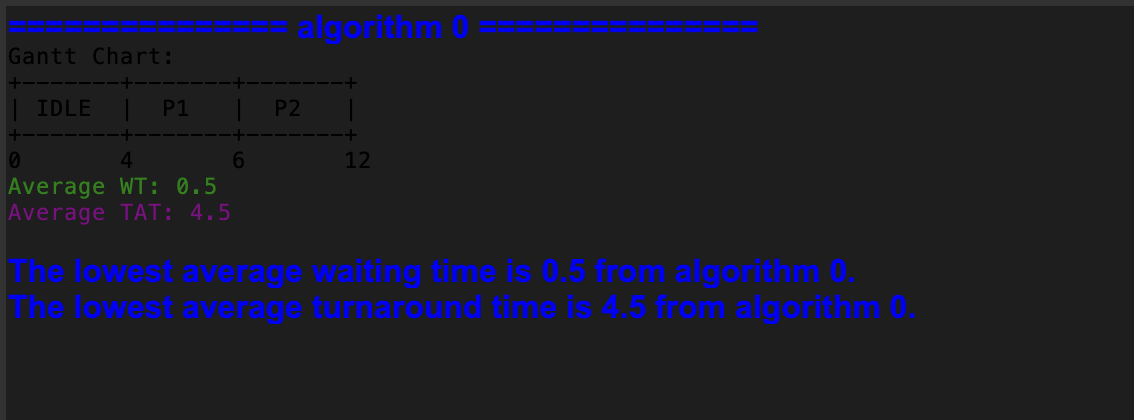
I used C structs and separate source files for FCFS, SJF/SRTF, Round Robin, Priority, formatting, random input, and output handling. The command-line flow validates inputs, supports manual or random processes and preemptive choices, writes Gantt charts and tables to output.txt, and uses result.py to compare selected algorithms in a Tkinter window.
Outcome & Reflection
The repository calculates waiting time, turnaround time, and CPU utilization and writes the results for comparison; it does not report a measured performance result or user outcome. I would keep the algorithm-per-file structure and next verify the build from a clean checkout with repeatable edge-case inputs for idle CPU time and tie-breaking.